
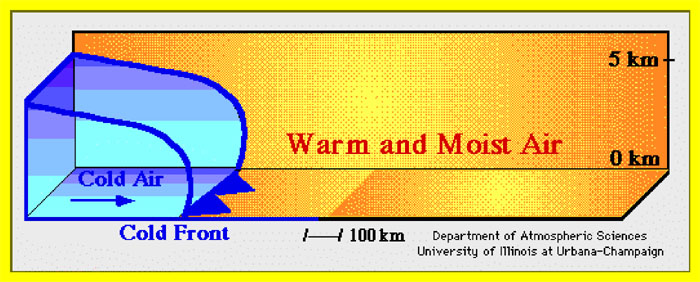
3D Rendering of a Cold Front.jpg
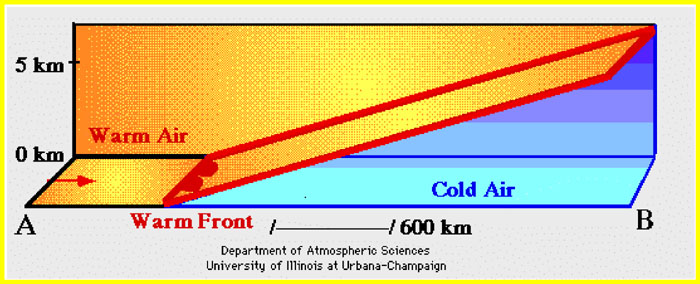
3D Rendering of a Warm Front.jpg
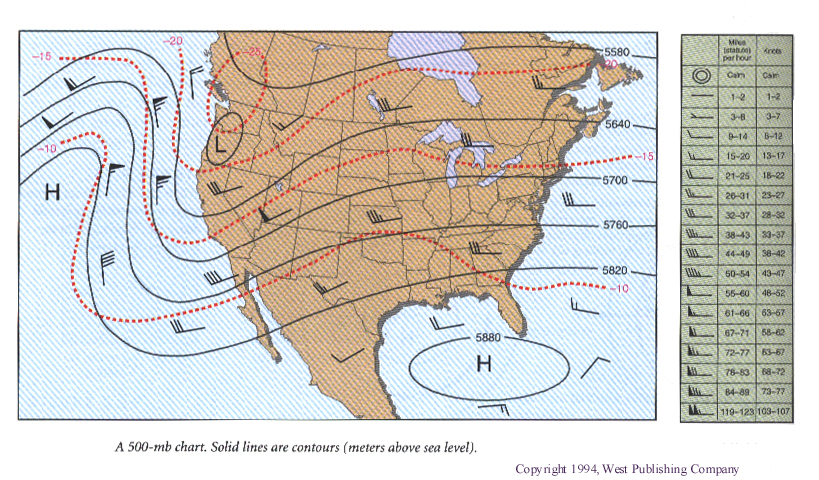
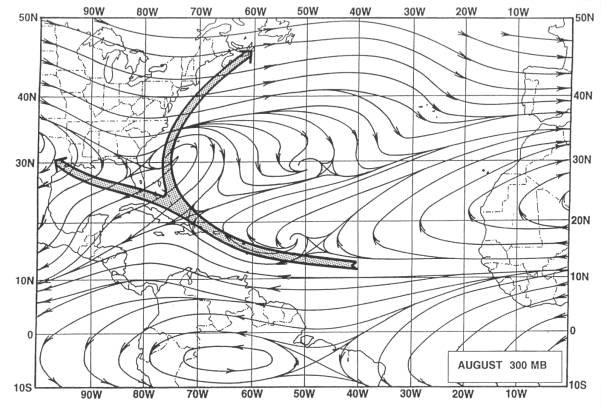
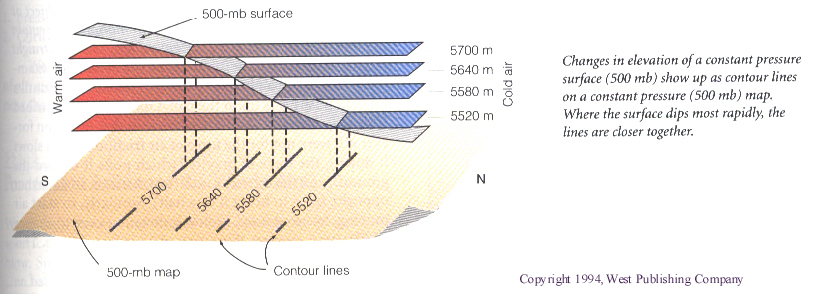
500-mb Chart.jpg
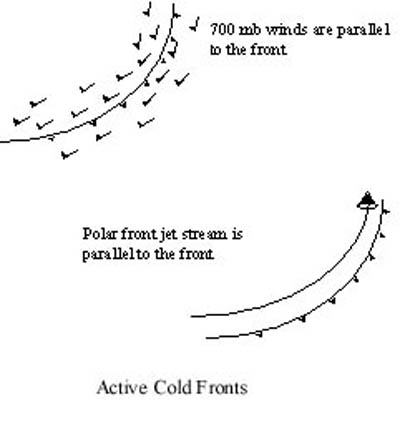
ActiveColdFronts.jpg
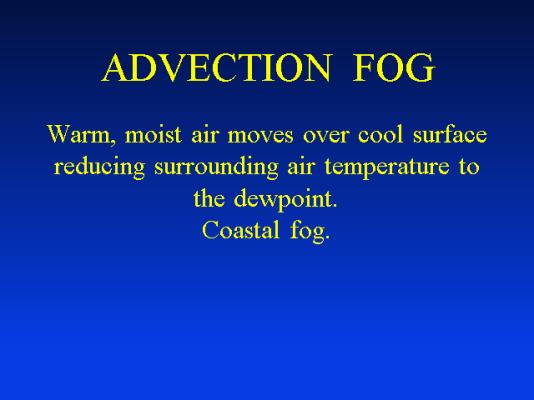
Advection Fog Definition.jpg
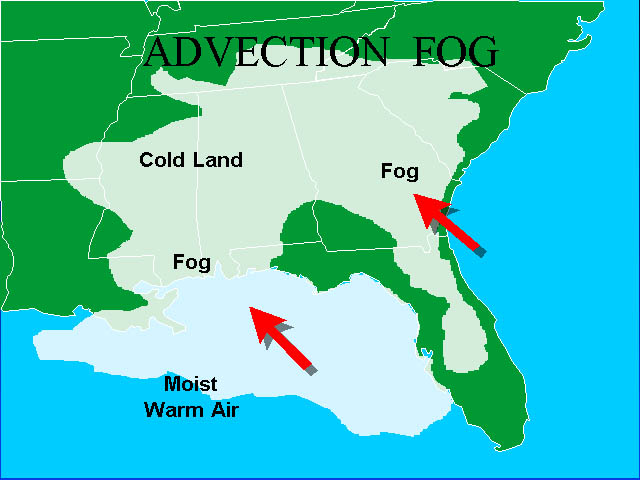
Advection Fog From Gulf.jpg
A Hurricane Tracking Chart.gif
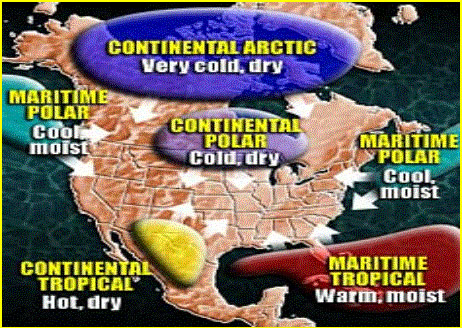
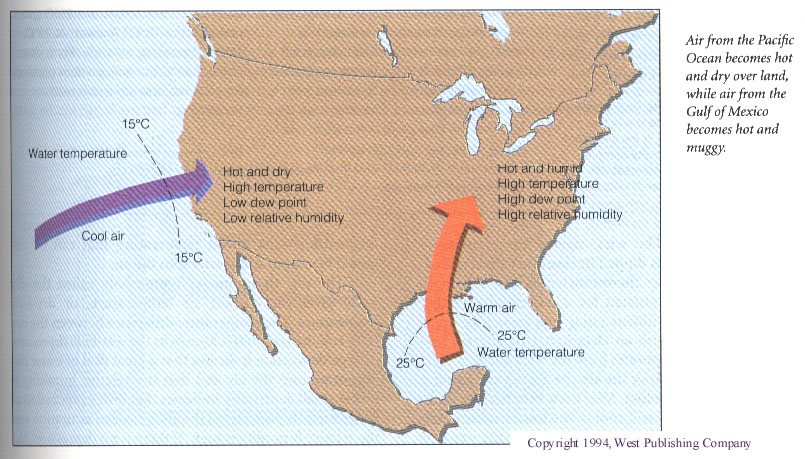
Air Masses.jpg
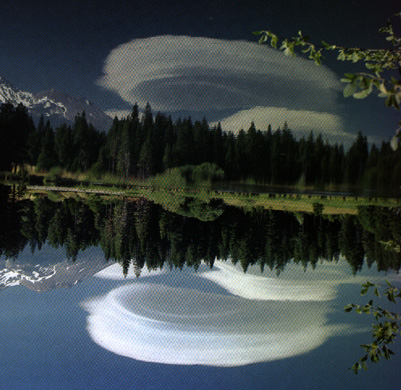
A lenticular cloud.gif
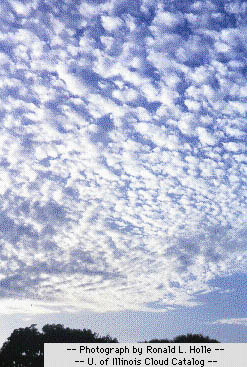
Altocumulus Clouds.jpg
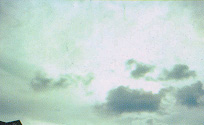
AltoStratus Clouds _1.jpg
AltoStratus Clouds _2.jpg
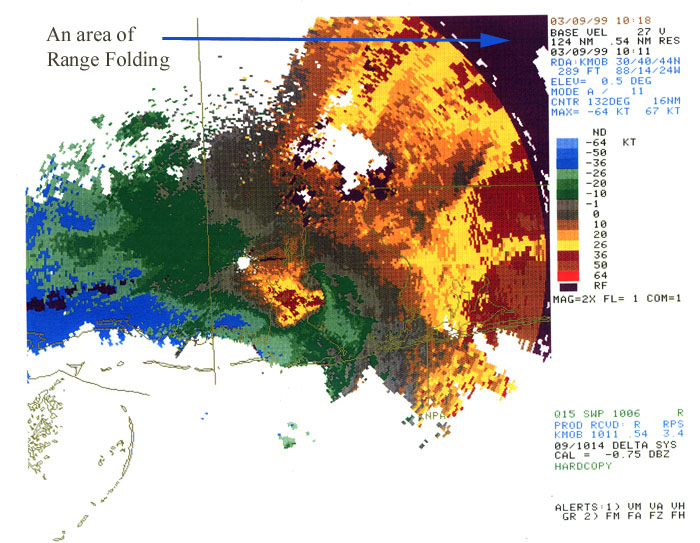
An area of Range Folding.jpg
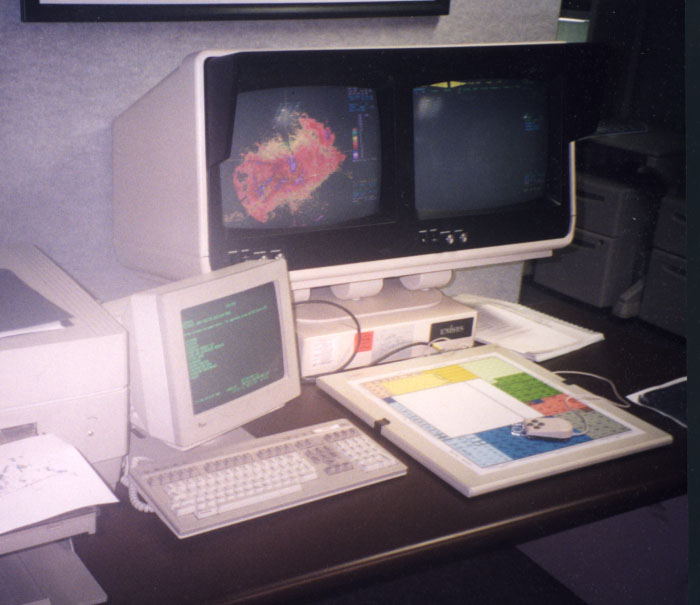
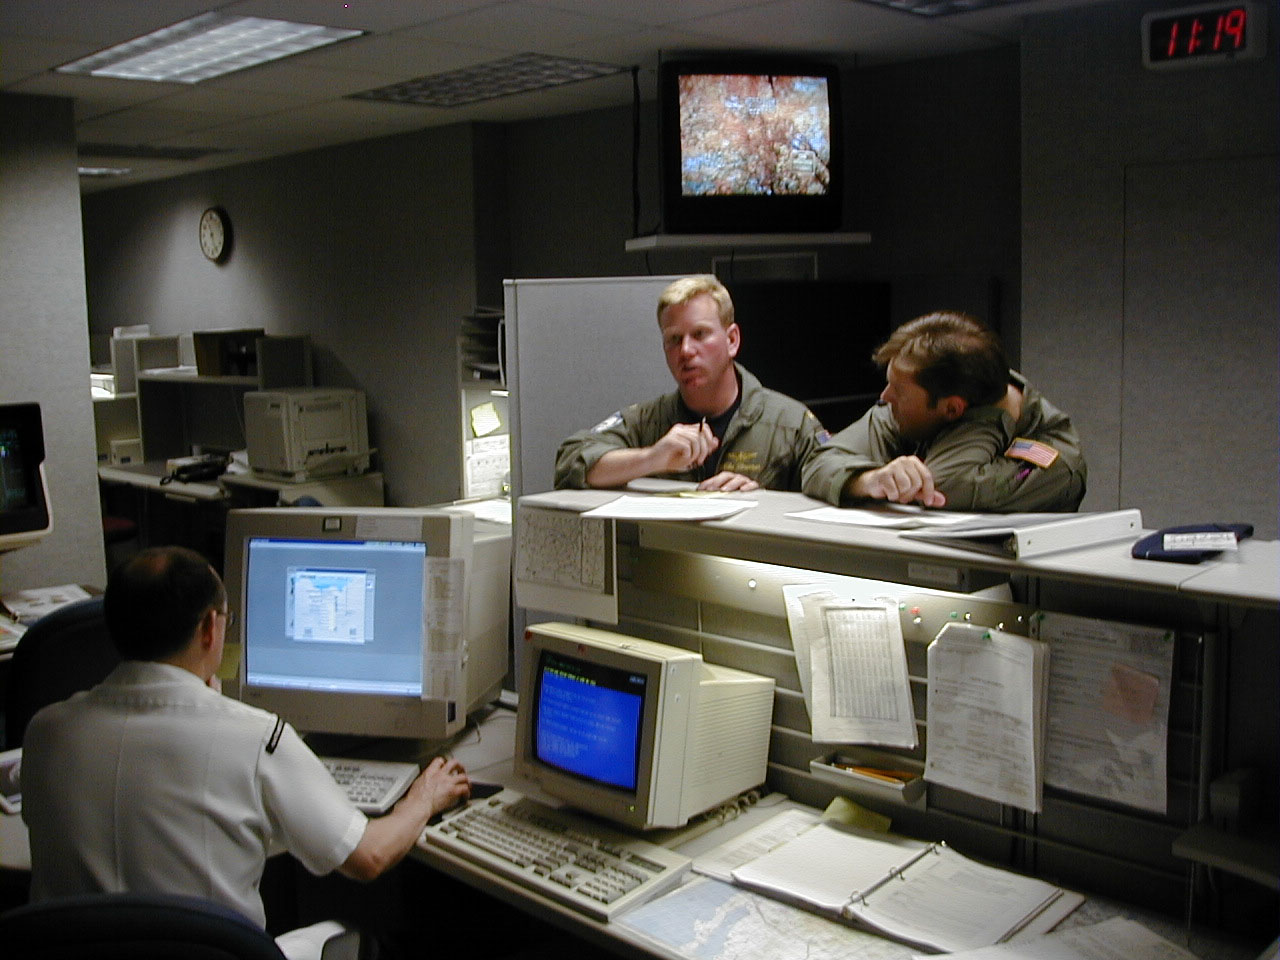
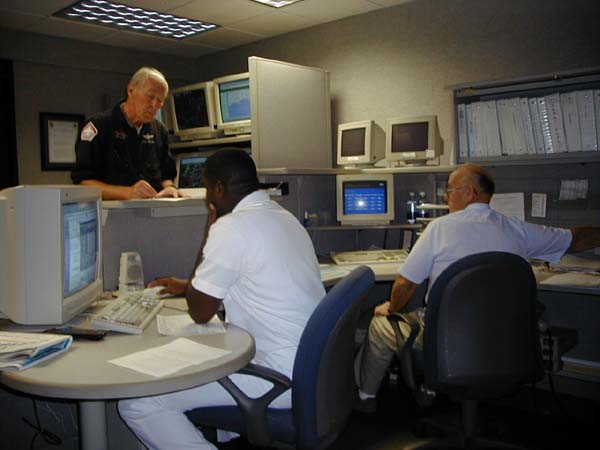
An FDO_SRF Workstation.jpg
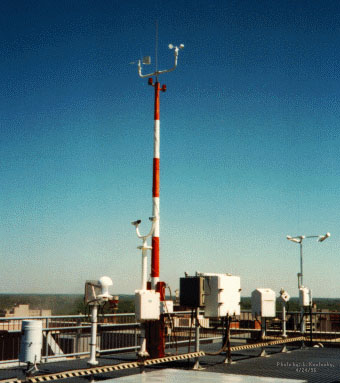
ASOS Sensors.jpg
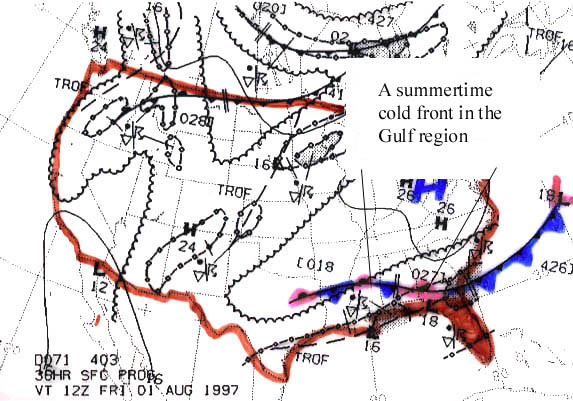
A Summertime Cold Front.jpg
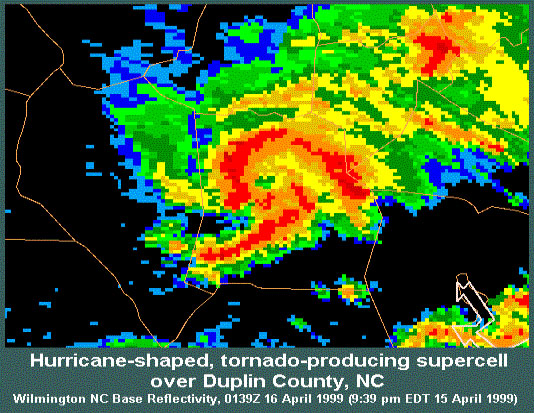
A Supercell on NEXRAD.jpg
A Tropical Storm - GOES IR.gif
August Tropical Cyclone Tracks.jpg
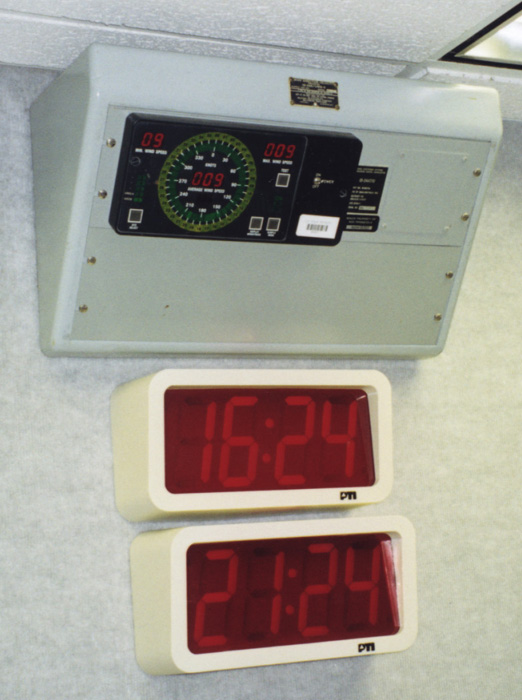
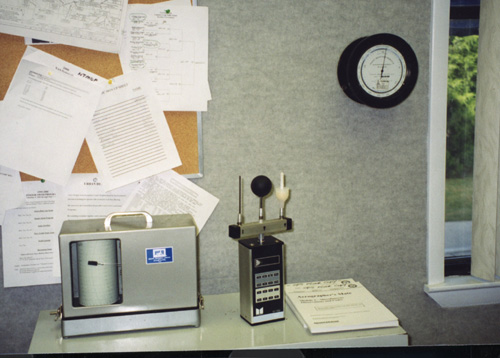
Barometer_ Clock_ etc_dot.jpg
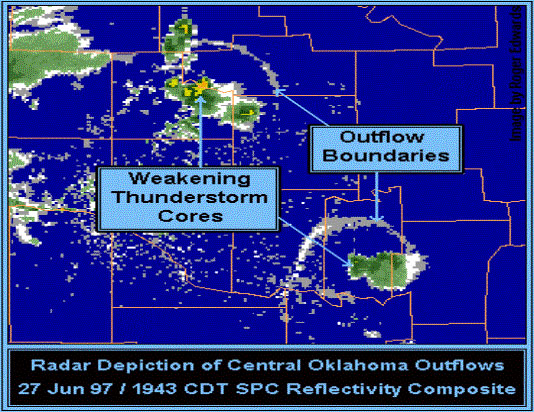
Base Reflectivity OutFlows.jpg
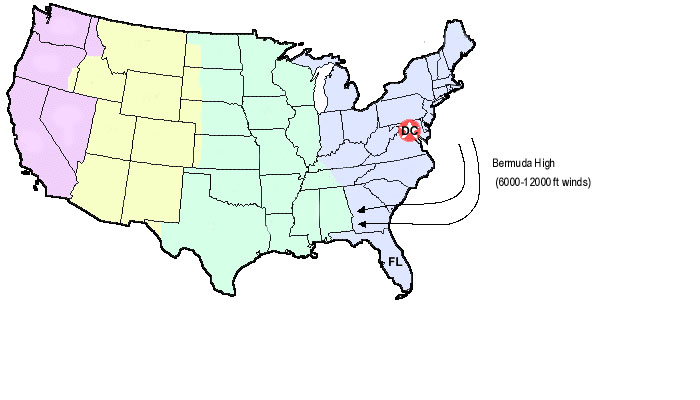
Bermuda High.jpg
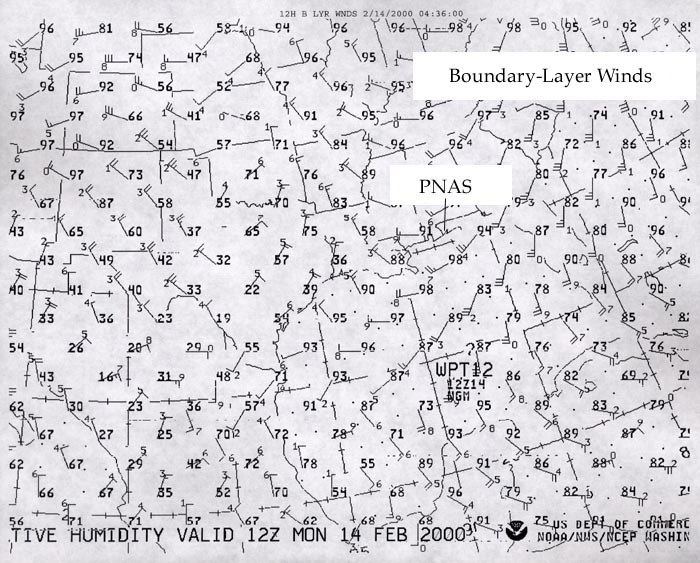
Boundary Layer.jpg
Buoy data chart.jpg
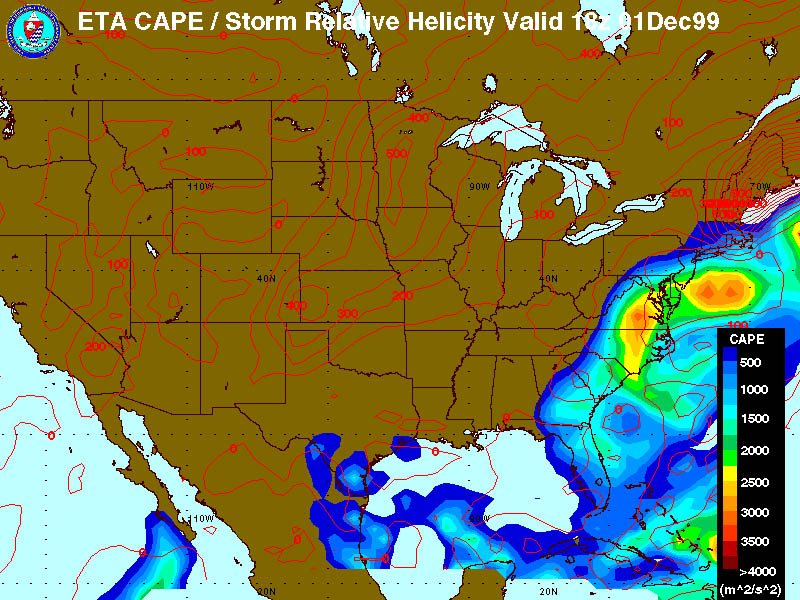
CAPE Example.jpg
CirroStratus Clouds.jpg
Cirrus Clouds.jpg
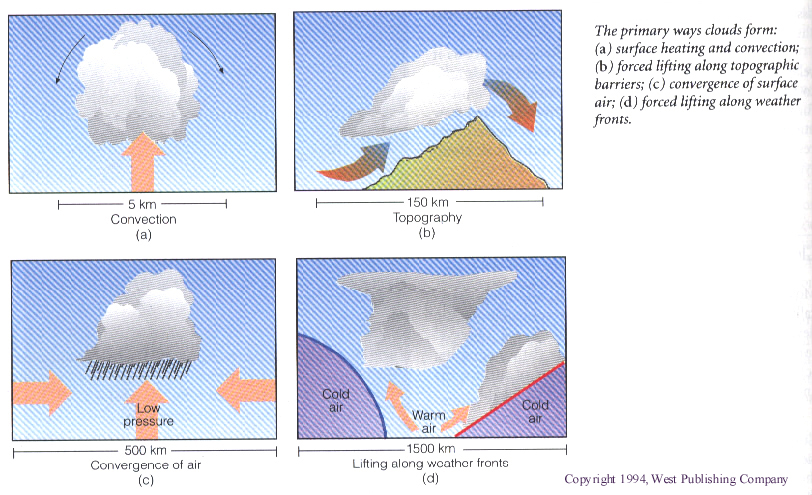
Cloud Formation.jpg
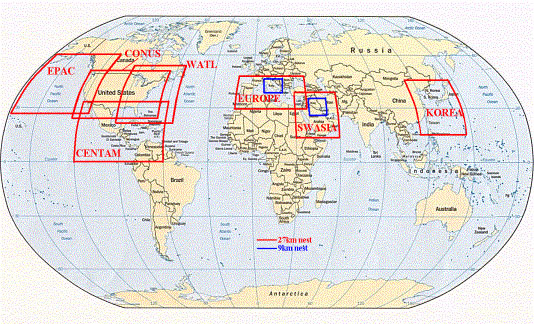
COAMPS Regions.jpg
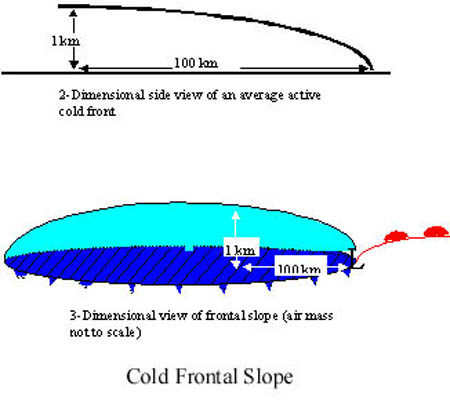
ColdFrontalSlope.jpg
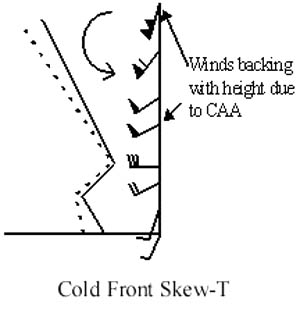
ColdFrontSkew-T.jpg
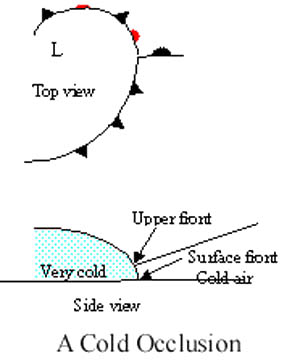
ColdOcclusion.jpg
Composite Reflectivity.gif
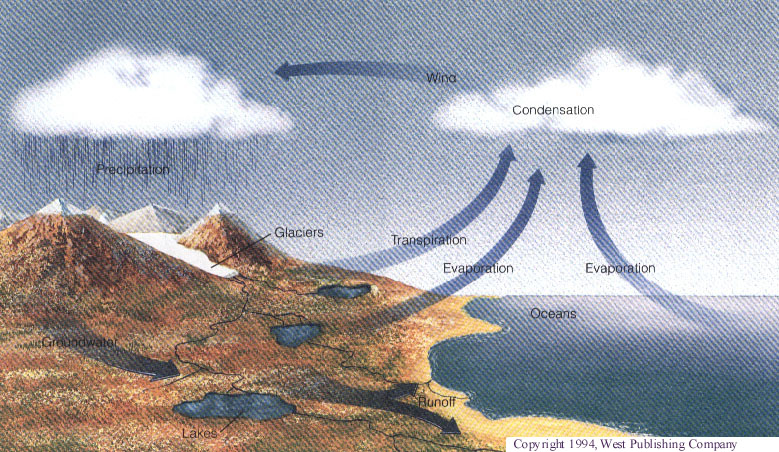
Condensation.jpg
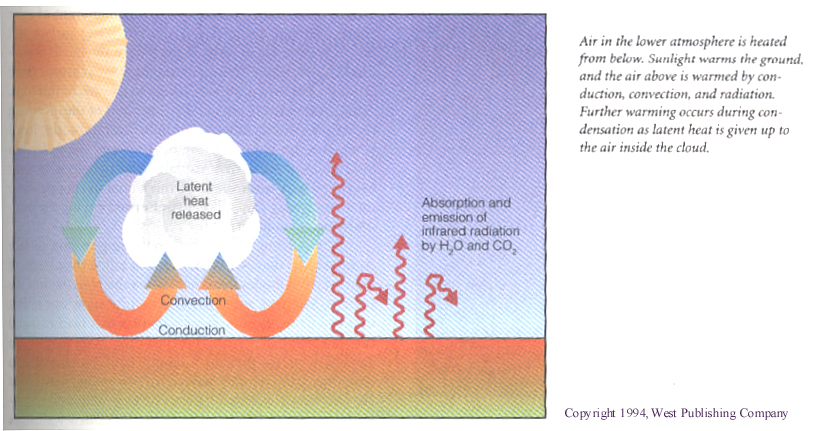
Convection.jpg
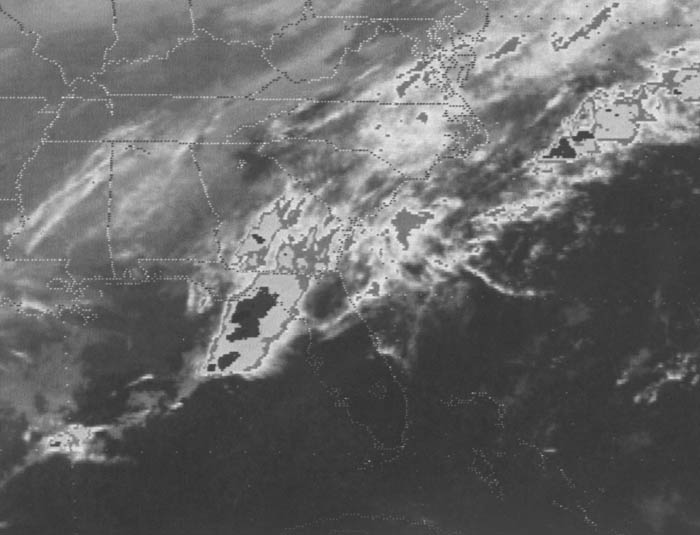
ConvectionIRSat.jpg
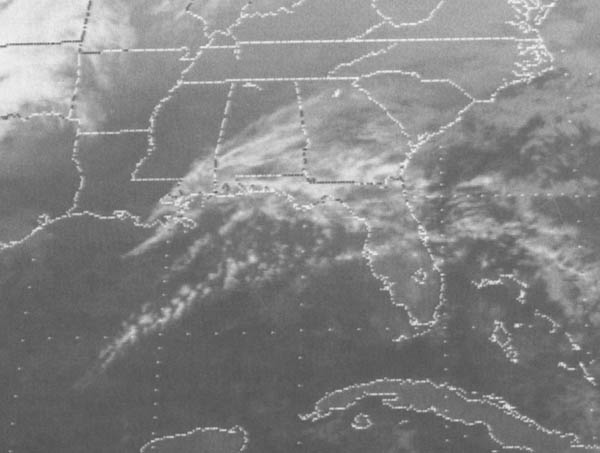
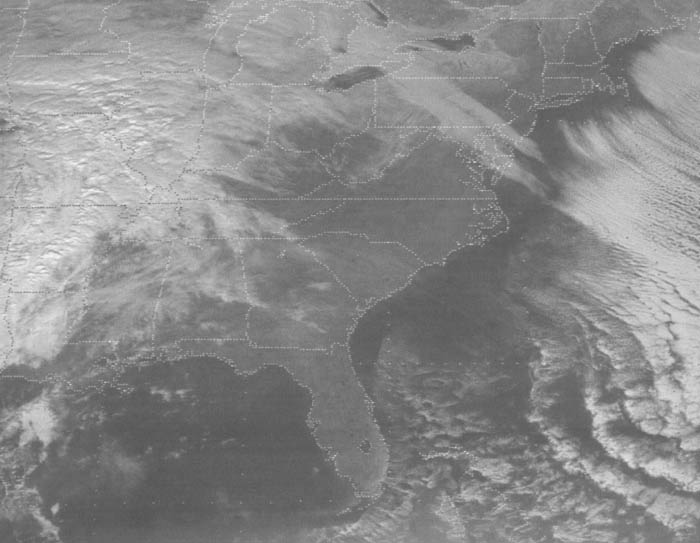
ConvectionSEUS.jpg
Convergence.jpg
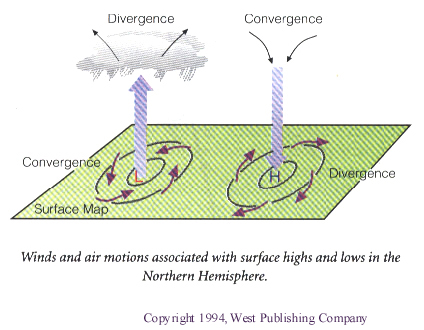
Convergence-Divergence.jpg
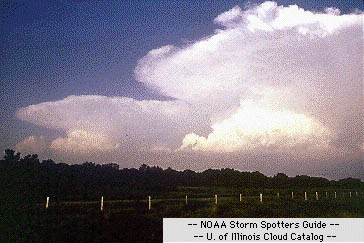
Cumulonimbus Clouds.jpg
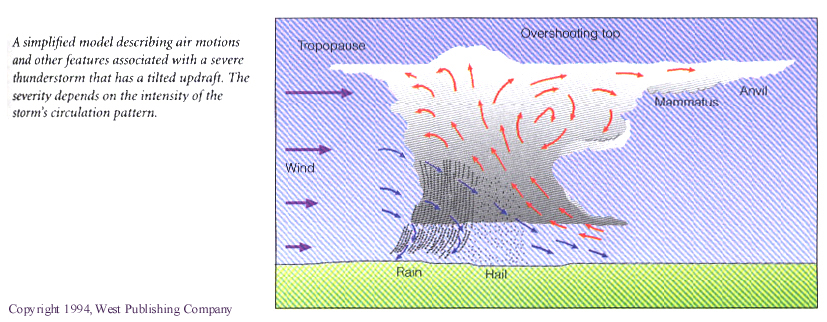
CumuloNimbus Structure.jpg
CumulusClouds.jpg
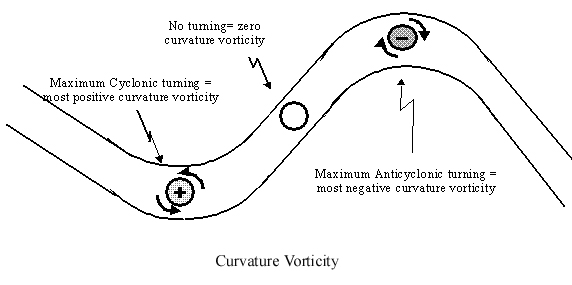
CurvatureVorticity.jpg
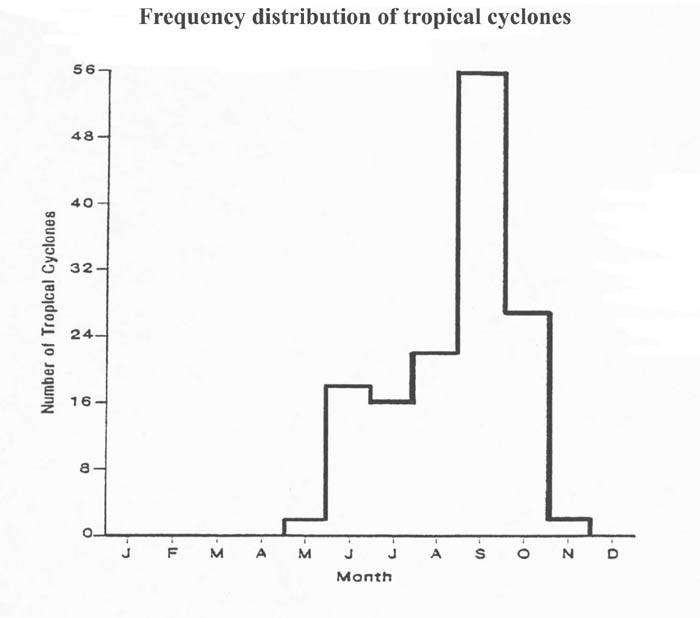
CycloneDistribution.jpg
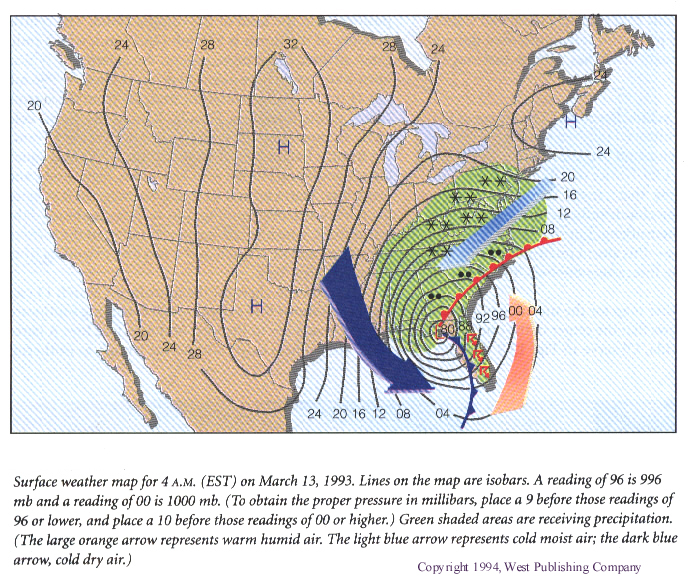
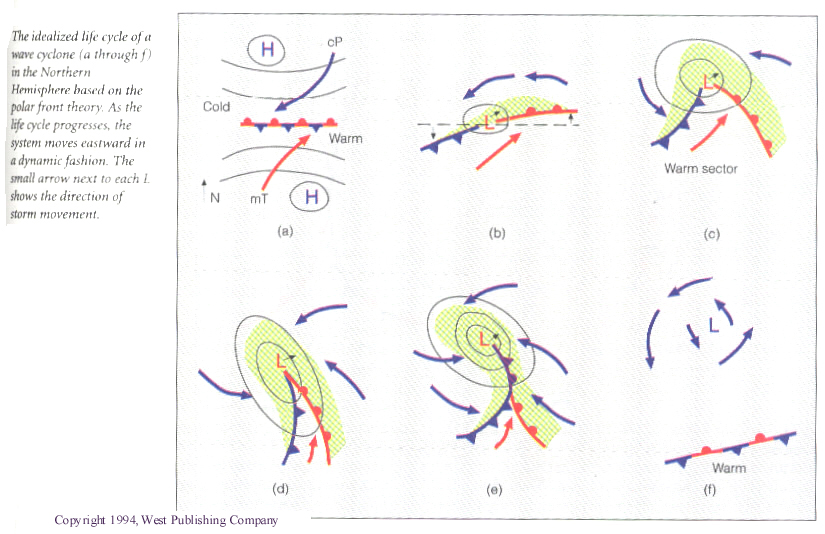
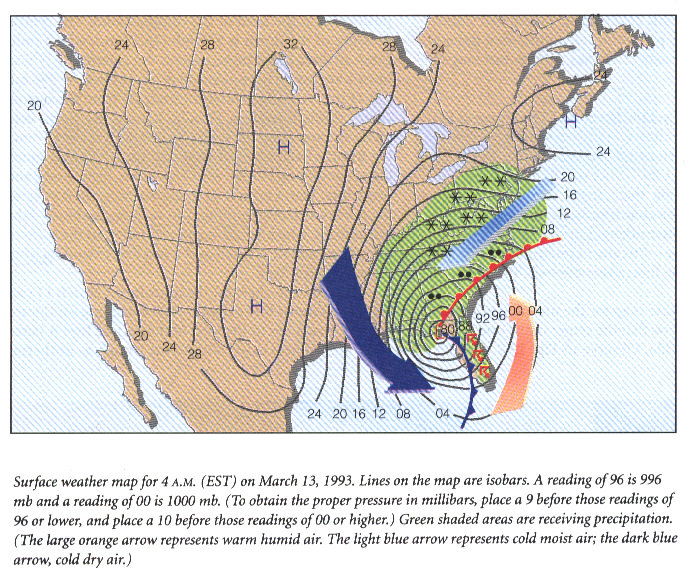
Cyclone Surface Map.jpg
DirOfApproach.jpg
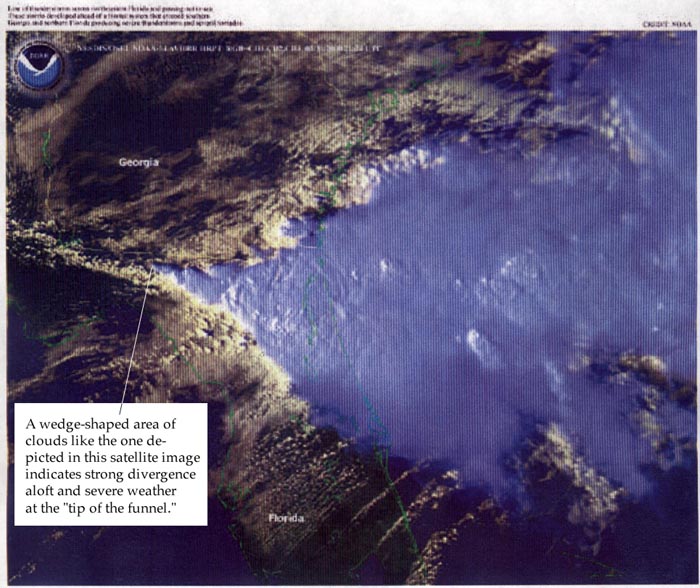
Divergence Aloft.jpg
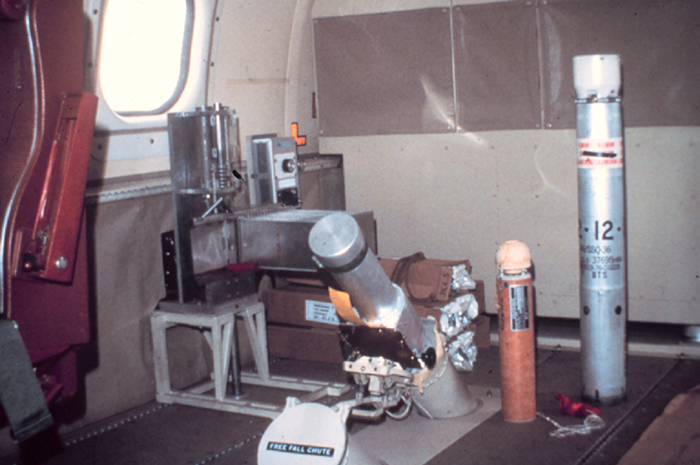
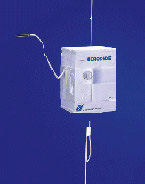
Dropwindsonde Cannister.jpg
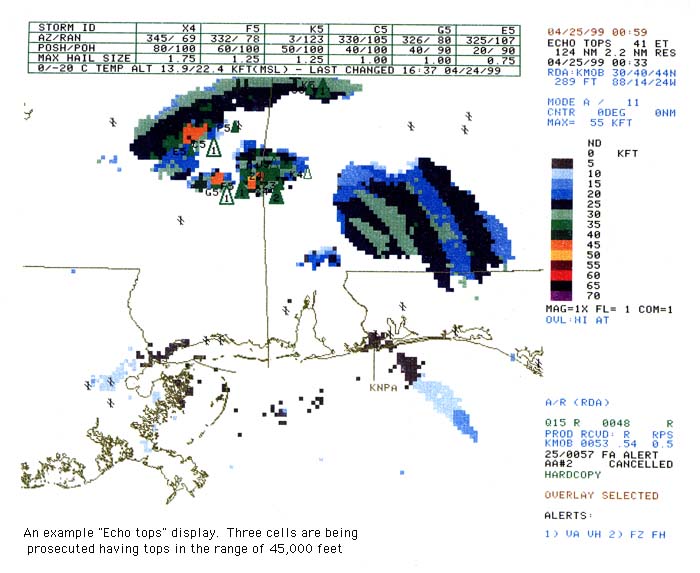
EchoTops in the Gulf.jpg
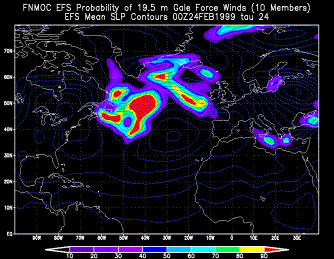
EFS depiction of Gale Force Winds.jpg
EFS Gale Force Winds.jpg
Example Image from Eglin Radar-30Sept2000.jpg
Example Image from Mobile Radar - 30September 2000.jpg
Floyd's Hurricane Track.gif
Forecast Duty Officer Station.jpg
Friction Layer.jpg
FrontalPassage.jpg
Fronts.jpg
Gate to Gate shear_ Tornado signature Example 1.jpg
Gate to Gate Tornado Signature Example 2.jpg
Georges.gif
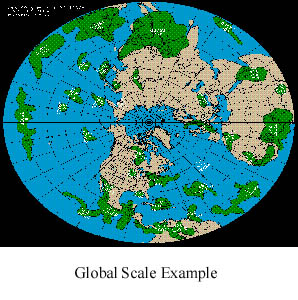
GlobalScale.jpg
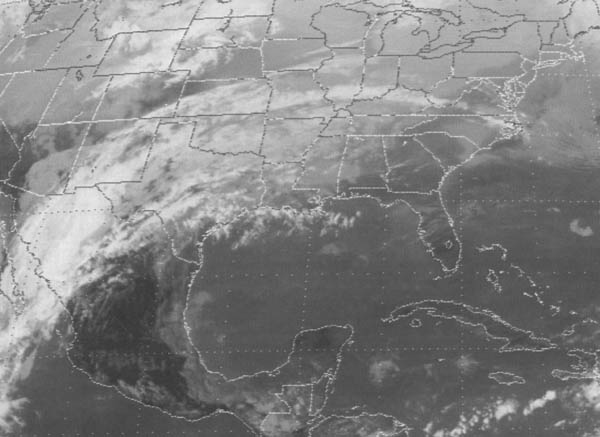
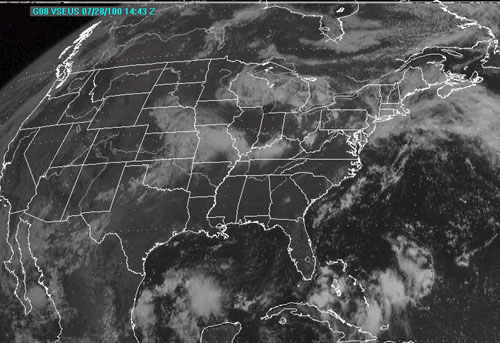
GOES-8 IR of Gulf Region.jpg
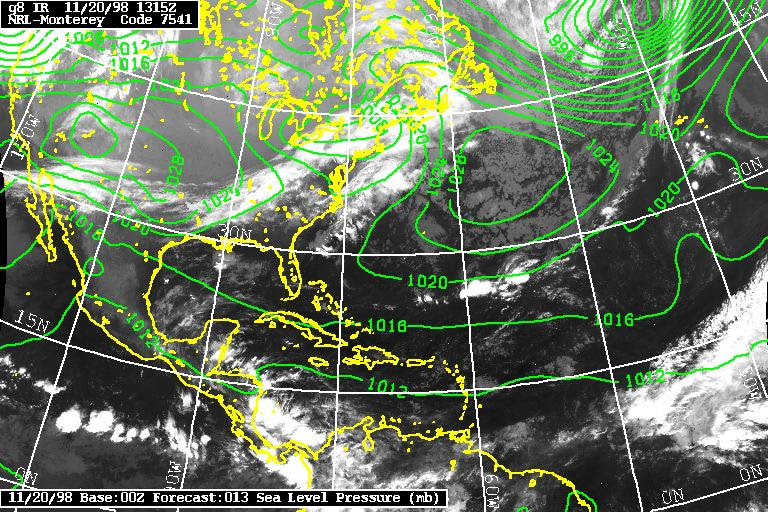
GOES8 Surface Pressures.jpg
GOES8 Visible Hurricane in the Gulf.gif
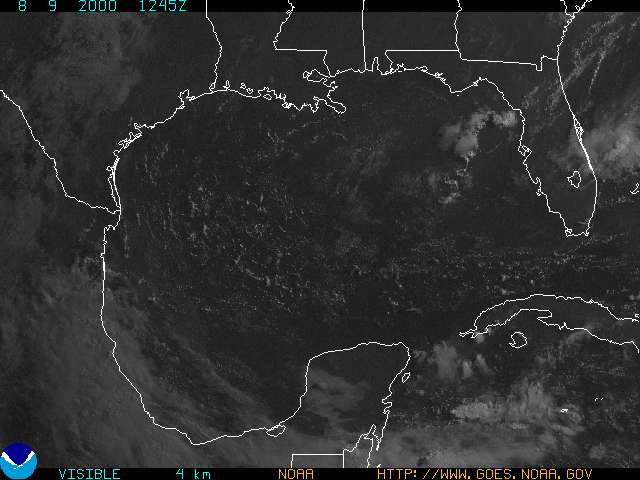
GOES-8 Visible Image of Gulf.jpg
GOES High Level Winds.gif
GOES Tropica lStorm HighLevelwinds.gif
GOES Visibility Imagery.jpg
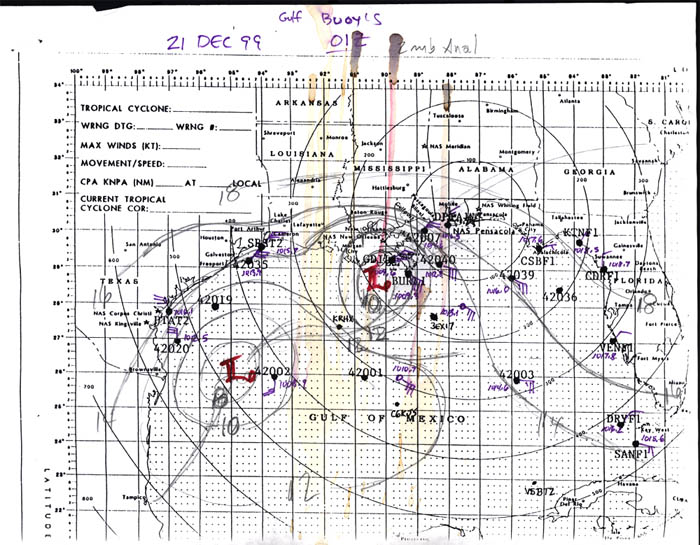
Hand Chart of Buoy Data.jpg
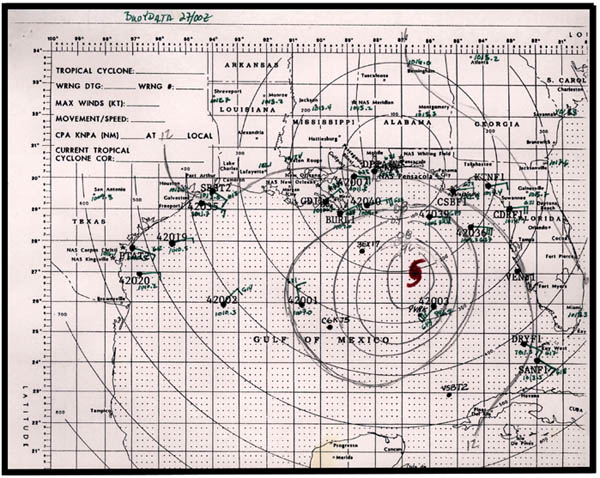
Hand chart of Hurricane in the Gulf.jpg
Haze.jpg
High-Altitude Turbulence.jpg
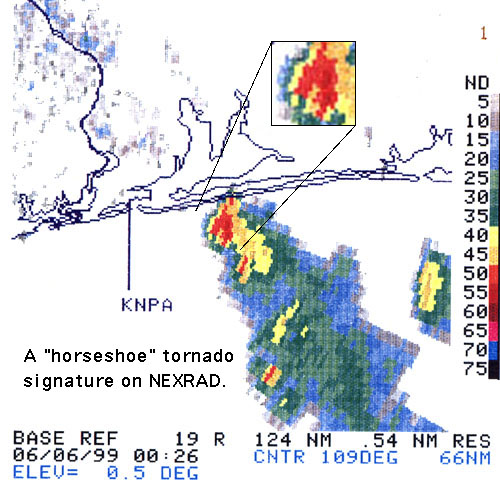
Horseshoe Signature _1.jpg
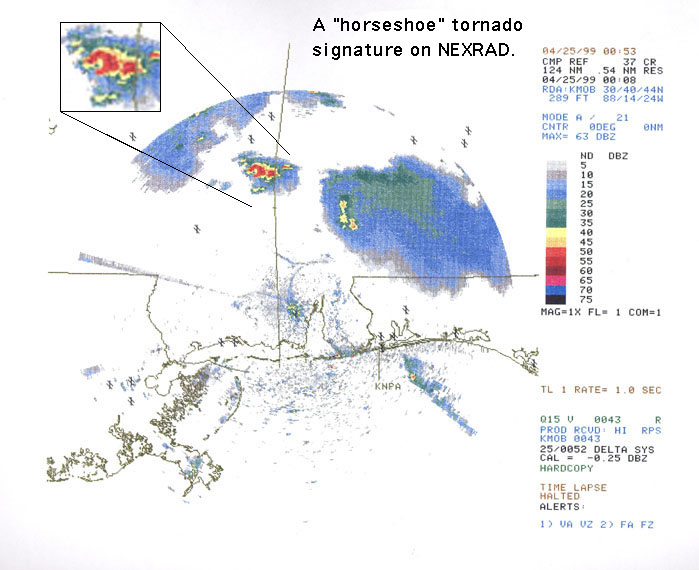
Horseshoe Signature _2.jpg
Humidity.jpg
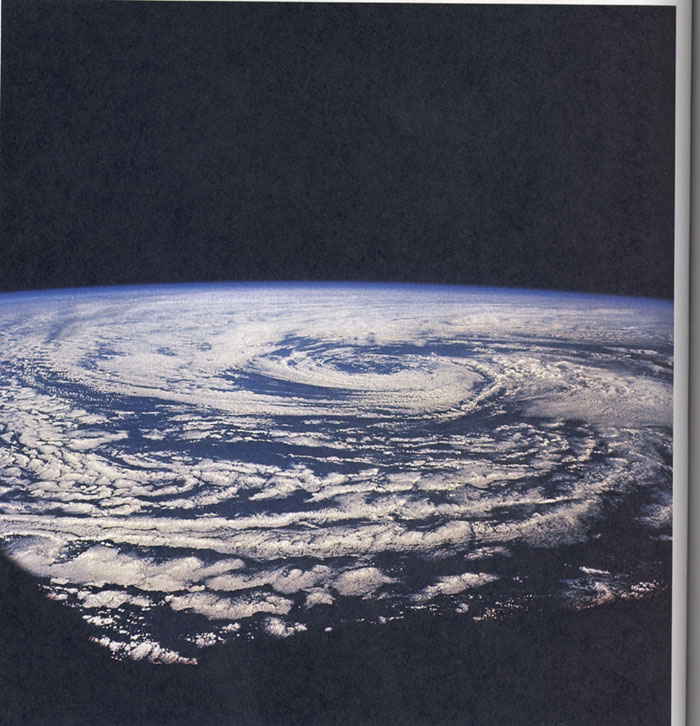
Hurricane courtesy of NASA.jpg
Hurricane Danny.gif
HurricaneDev.jpg
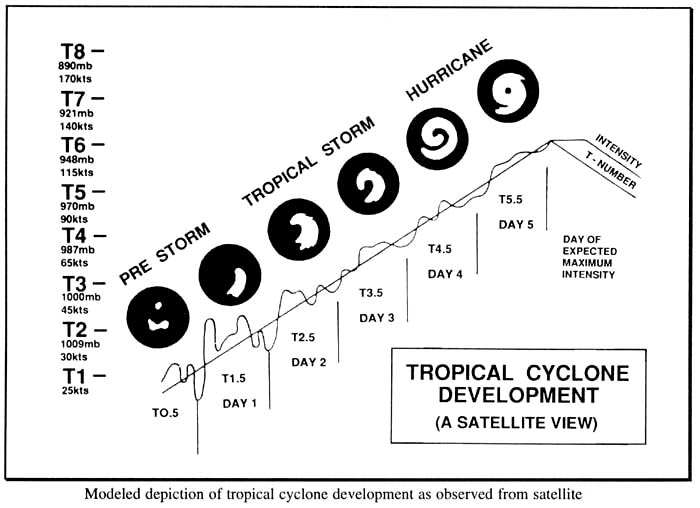
Hurricane Development.jpg
Hurricane Erin.gif
Hurricane Georges.gif
Hurricane Opal.gif
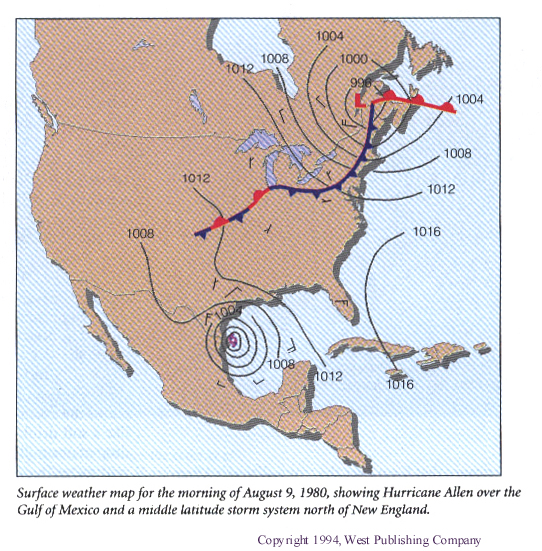
Hurricane Surface Map.jpg
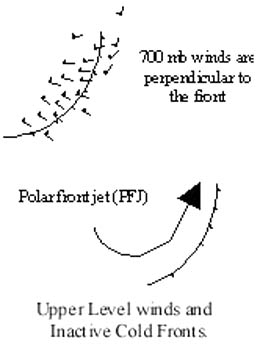
InactiveColdFronts.jpg
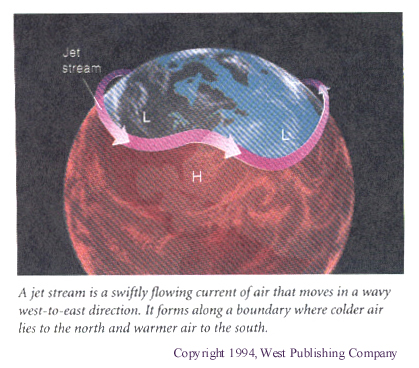
Jet Stream.jpg
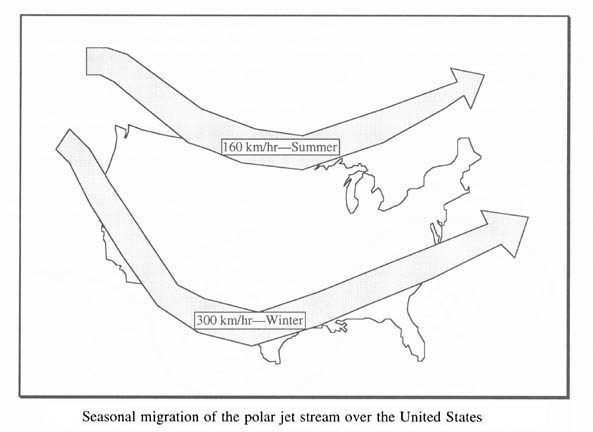
JetStreamMigration.jpg
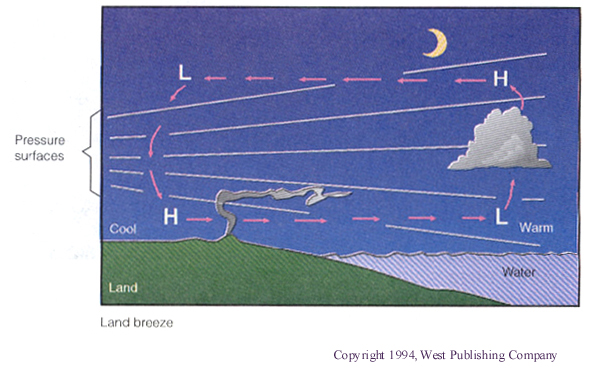
Land Breeze.jpg
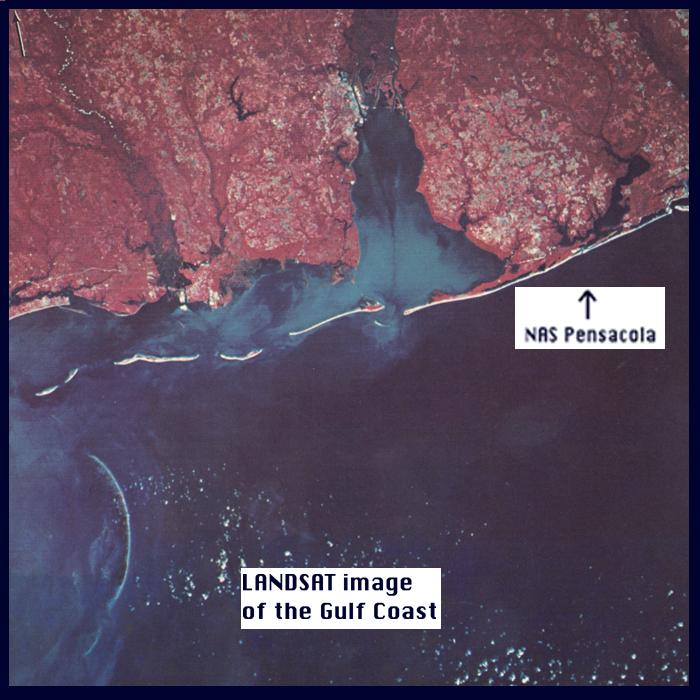
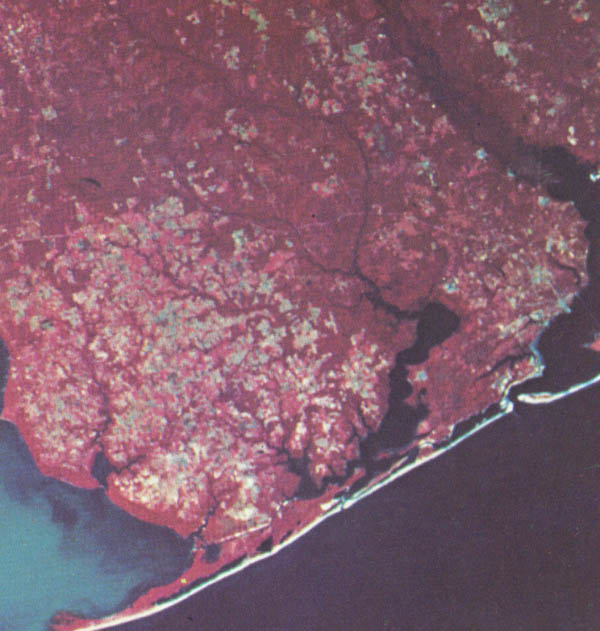
LANDSAT image of the Gulf Coast.jpg
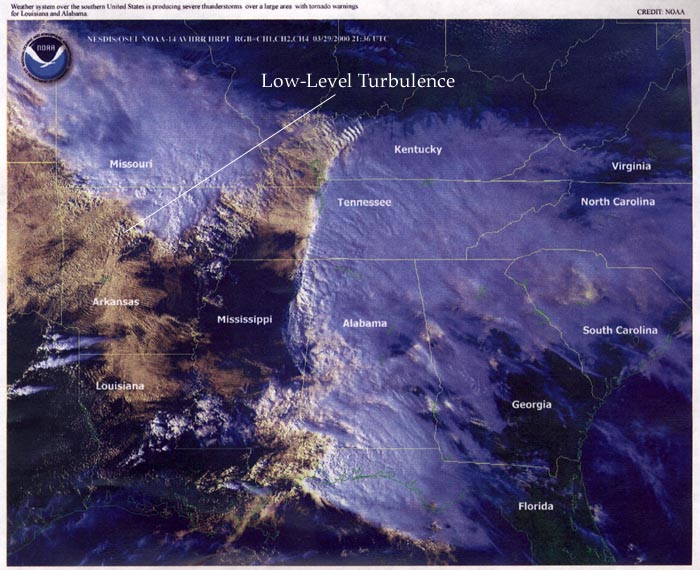
Low-level Turbulence.jpg
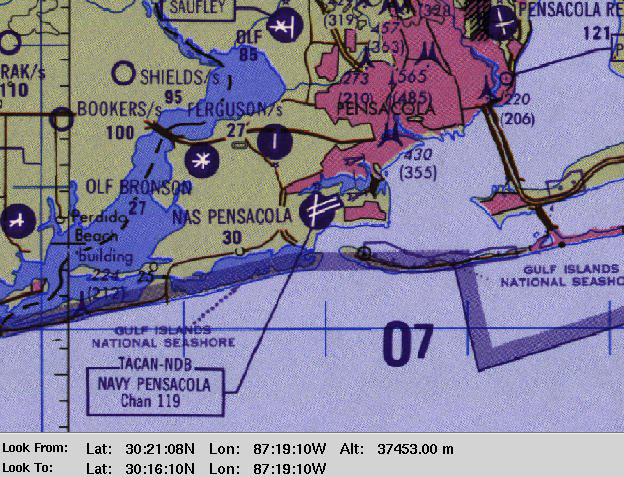
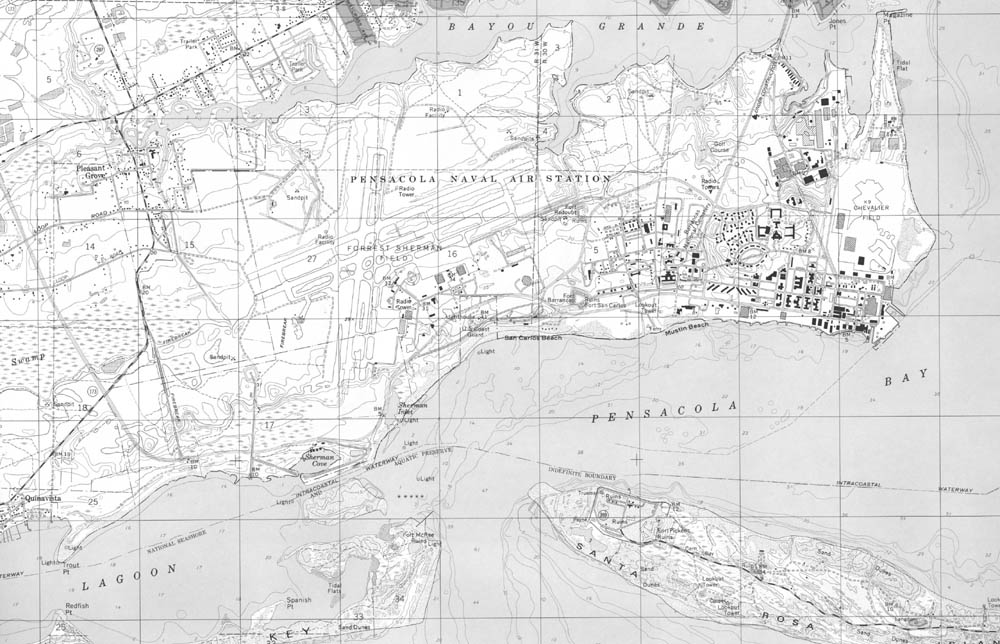
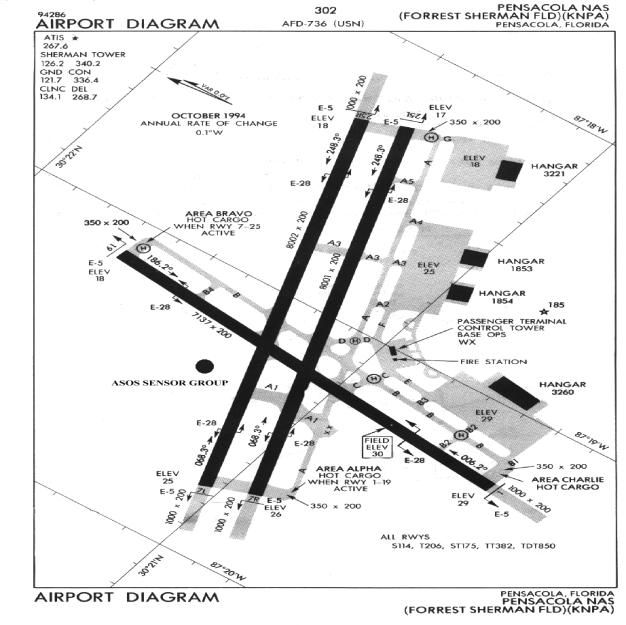
Map of Pensacola Naval Air Station.jpg
Map of the NASP Region.jpg
Measuring Equipment.jpg
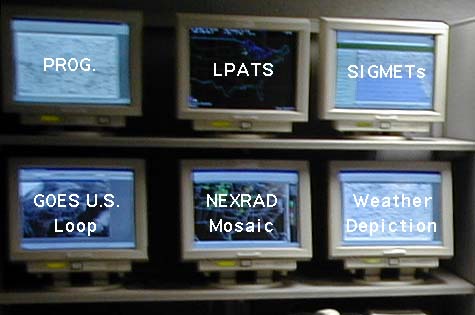
METOC Clients.gif
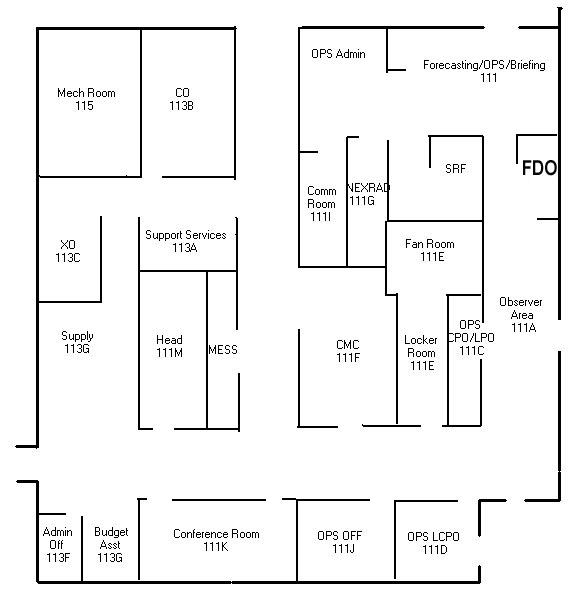
METOC Floorplan.jpg
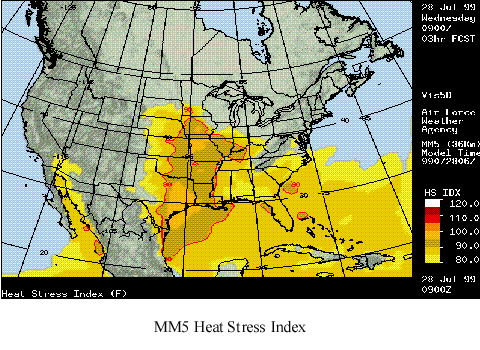
MM5HeatStress.jpg
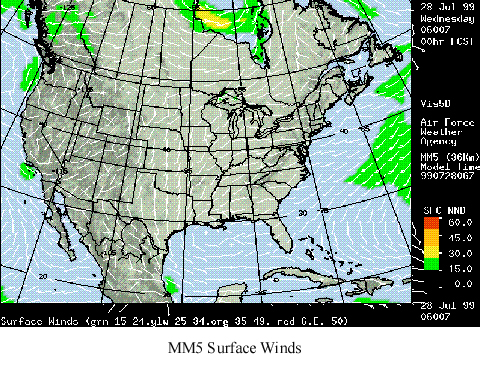
MM5SurfaceWinds.jpg
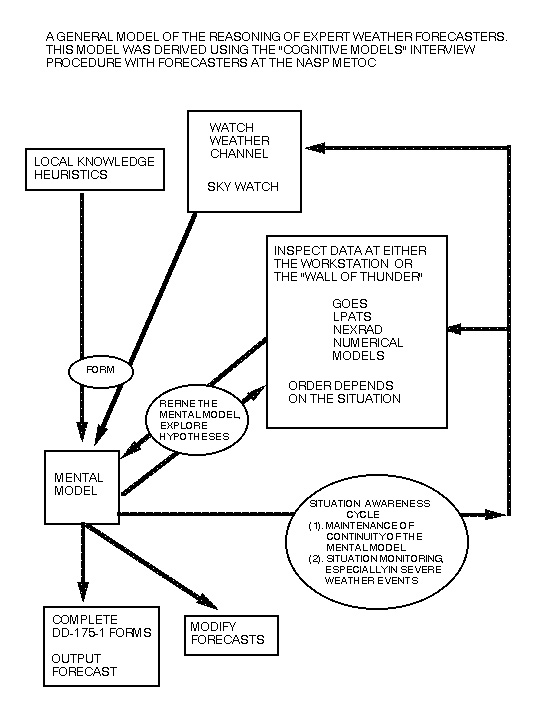
Model of Reasoning.jpg
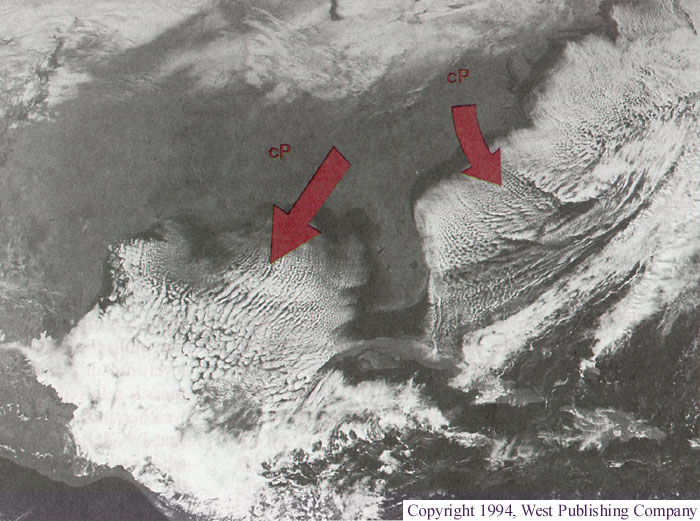
Modified cP Air Mass in Gulf Region.jpg
MountainRipples.jpg
NASA hurricane.jpg
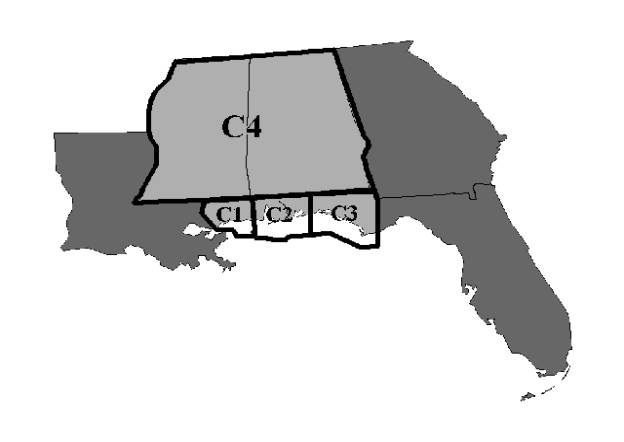
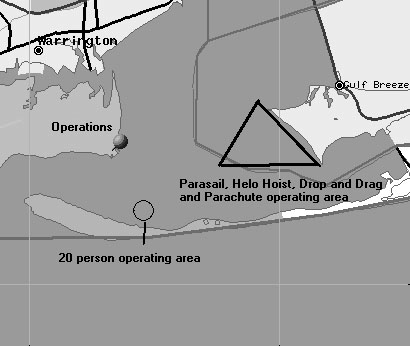
NASP Charlie Areas.jpg
NEXRAD Base Reflectivity OutFlow.jpg
NEXRAD GUI.jpg
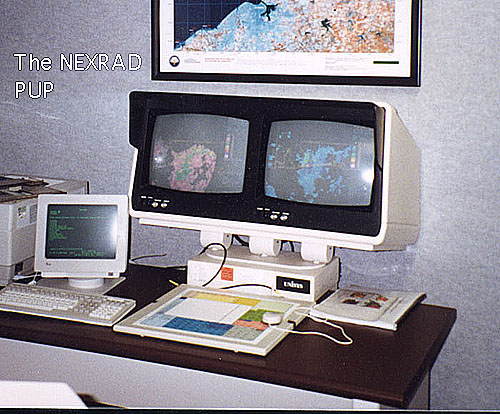
NEXRAD PUP.jpg
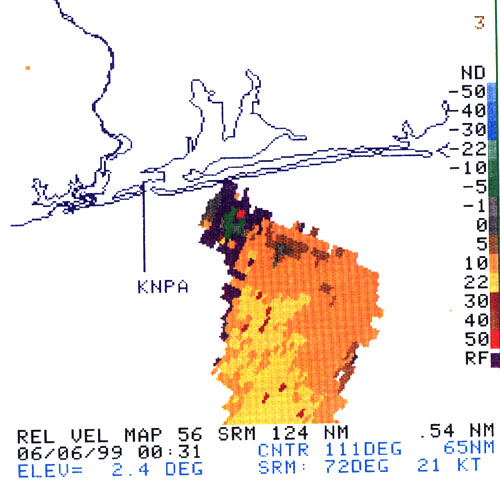
NEXRAD Radial Velocity.gif
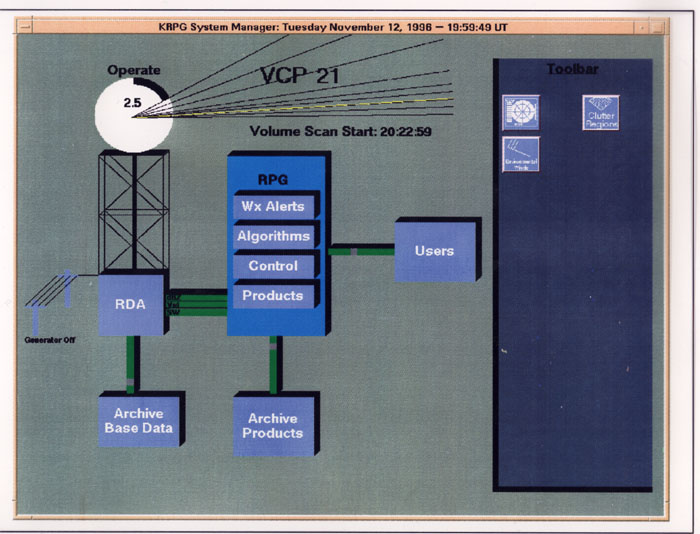
NEXRAD System Organization.jpg
NEXRAD Tornado signature.jpg
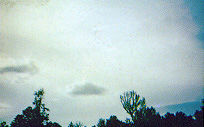
Nimbostratus Clouds.jpg
NOGAPS.gif
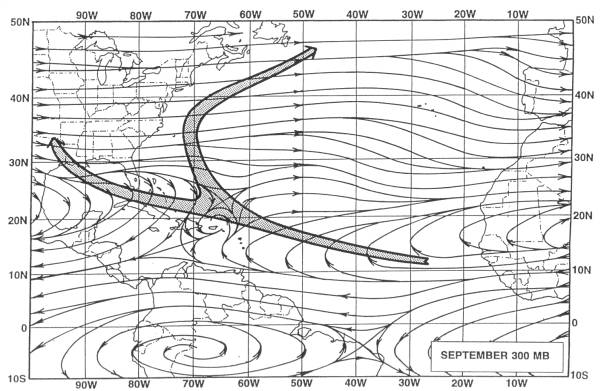
NOGAPS 300mb Chart.gif
NOGAPS Example 1.gif
NOGAPS Example 2.gif
October Tropical Cyclone Tracks.jpg
Outflow Boundaries NEXRAD.jpg
Outflow Boundaries on NEXRAD.jpg
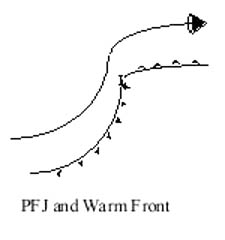
PFJAndWarmFront.jpg
PNASMap.jpg
PNASout2.jpg
Port Operations.jpg
Prefrontal Squall Lines.jpg
Pressure Gadient.jpg
Radar Base Reflectivity OutFlows.jpg
RADAR depiction of a Supercell.jpg
Radial Velocity.gif
Radiosonde Device.jpg
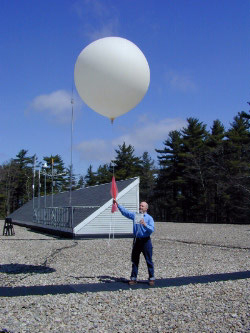
Radiosonde with Balloon.jpg
SAND.jpg
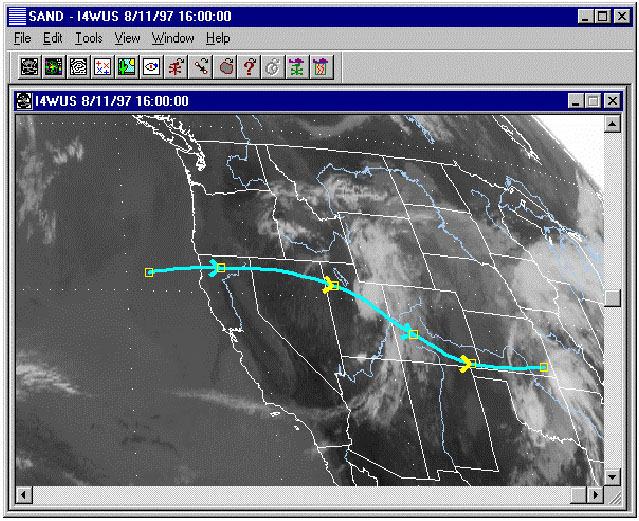
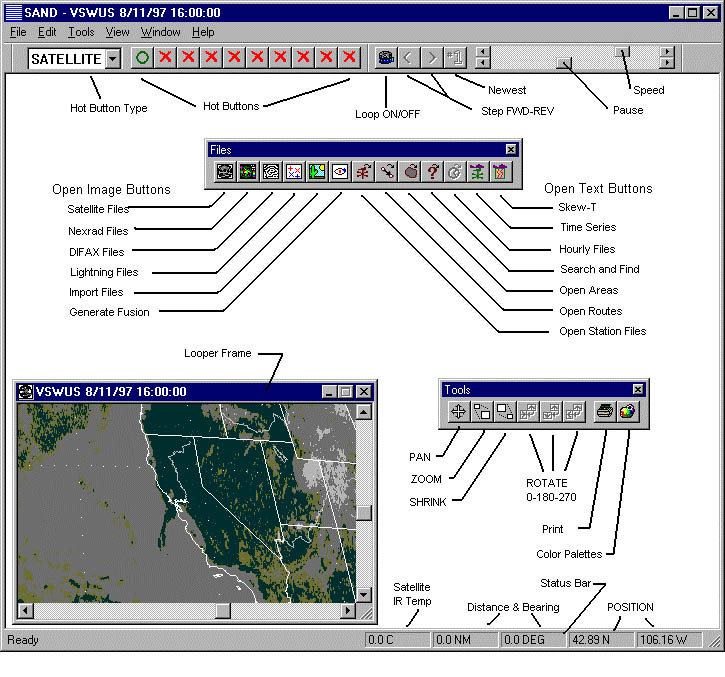
SAND interface.jpg
Satellite depicting Lifting.jpg
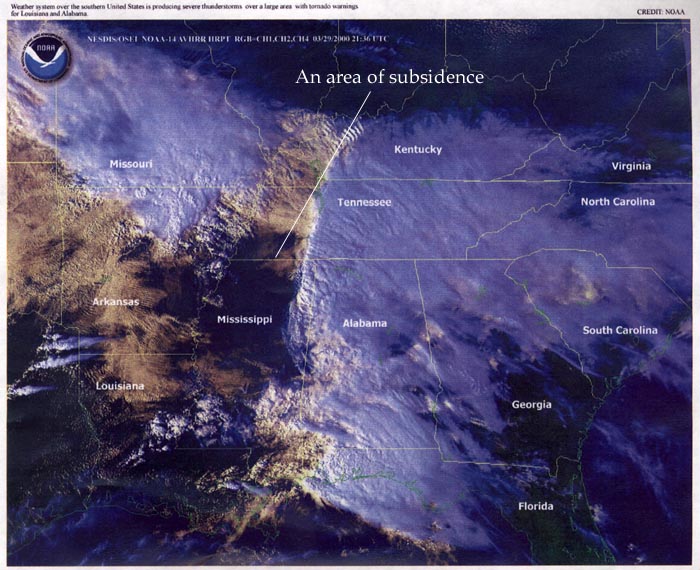
Satellite depiction of Subsidence.jpg
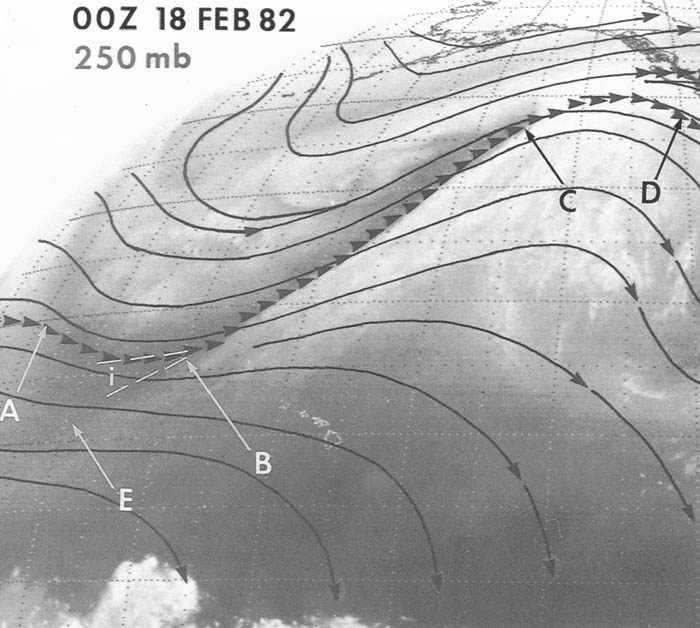
Satellite of Polar Front Jet.jpg
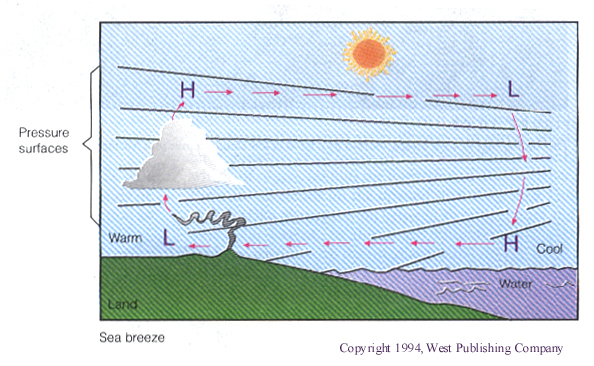
Sea Breeze.jpg
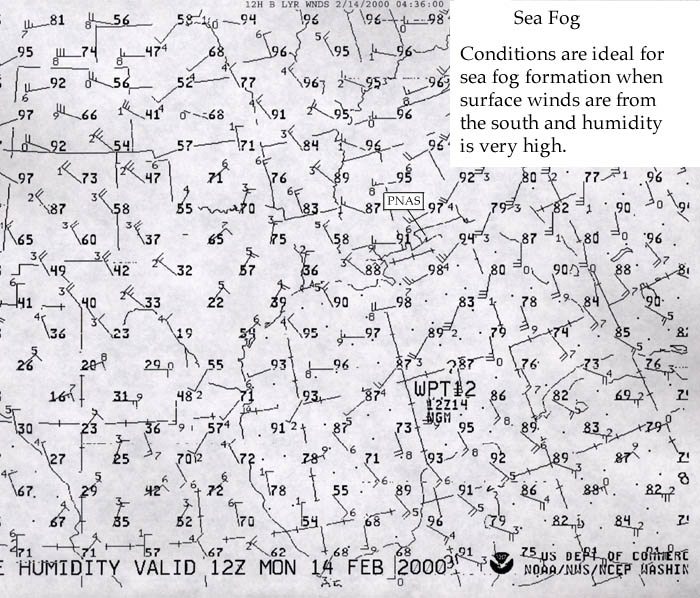
Sea Fog Surface winds & Humidity.jpg
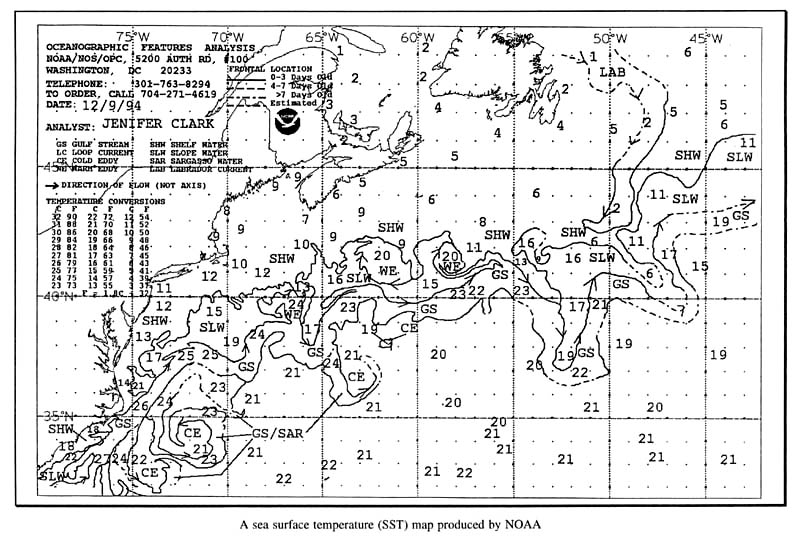
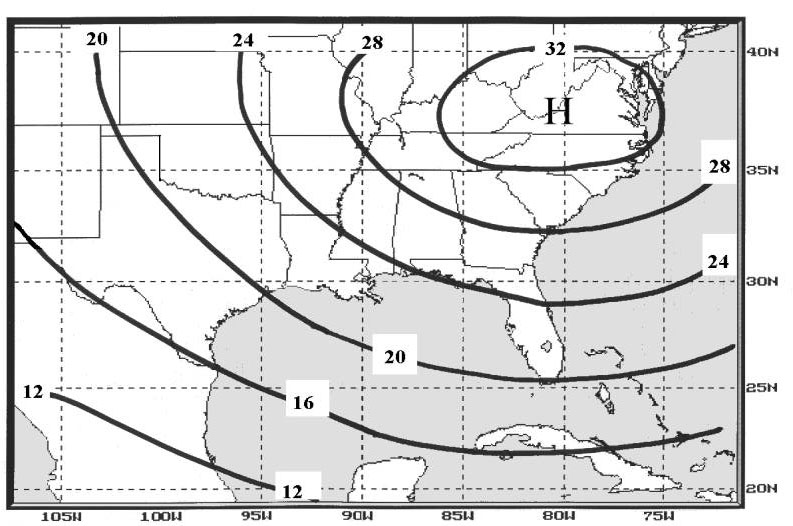
SeaSurfaceTemp.jpg
September Tropical Cyclone Tracks.jpg
Sherman Field.jpg
Skew-T from Jackson MS.gif
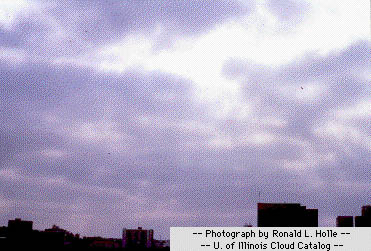
Skyblurred.jpg.jpg
SRF Workstation.jpg
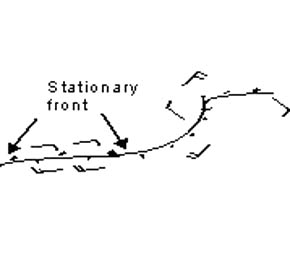
Stationary.jpg
Stratocumulus Clouds.jpg
Stratus Formation at KNPA.jpg
Subregional Forecaster Station.jpg
Supercell on RADAR.jpg
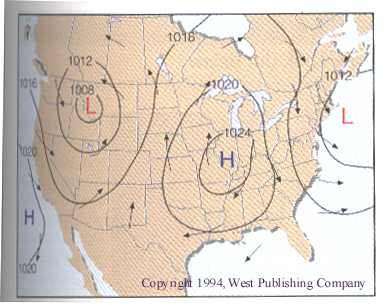
Surface Pressure Map.jpg
Surface Wind Chart.jpg
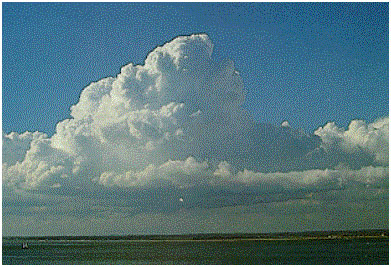
Swelling Cumulus Clouds.jpg
SynopticScale.jpg
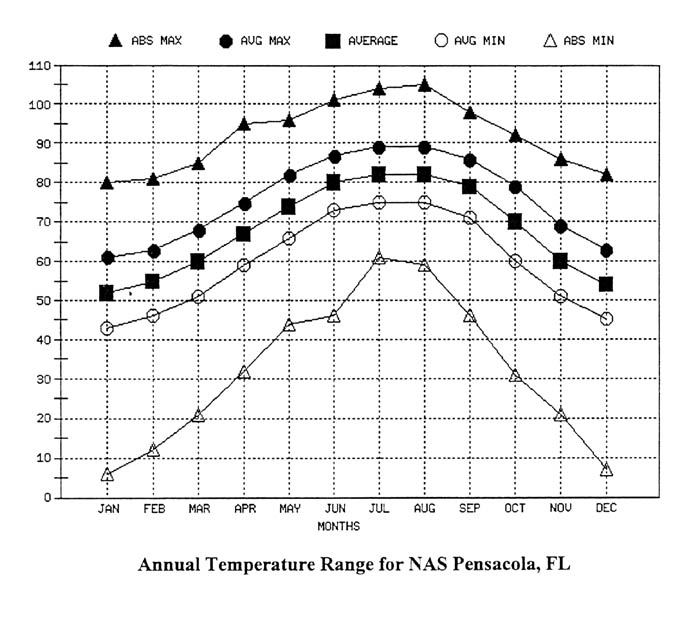
TemperatureRange.jpg
The Airport.jpg
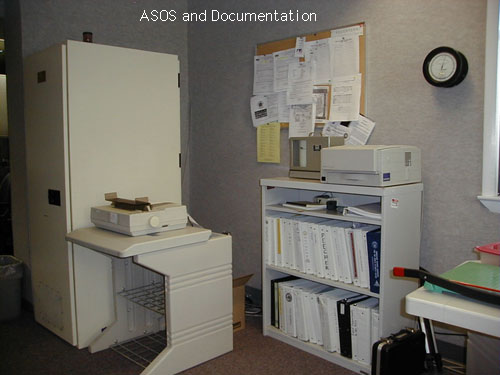
The ASOS and Documentation.jpg
The Boundary Layer.jpg
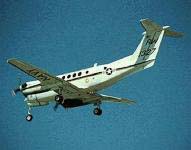
The C-12.jpg
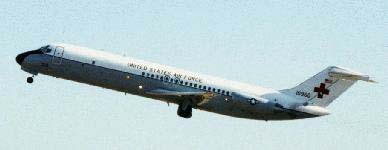
The C-9.jpg
The FDO WorkStation.jpg
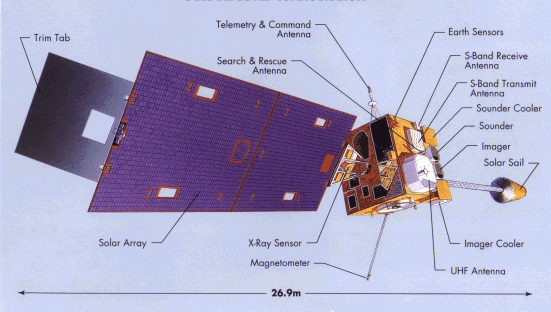
The GOES Satellite.jpg
The METOC ASOS.jpg
The NASP Air Operations Building.jpg
The NEXRAD PUP.jpg
The Wall of Thunder.jpg
Thumbs.db
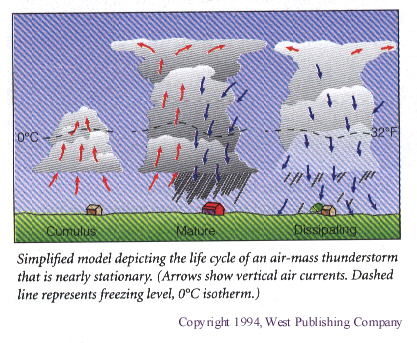
Thunderstorm Developmental Phases.jpg
Thunderstorm Development Phases.jpg
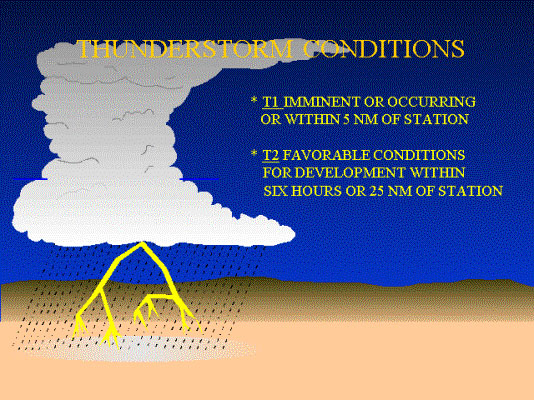
Thunderstorm Warnings.jpg
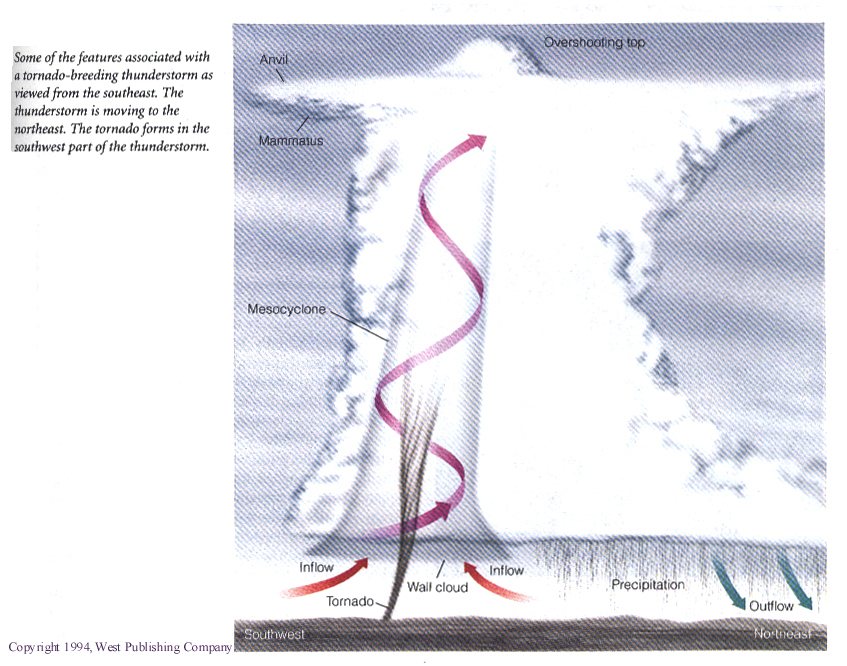
Tornado Structure.jpg
Tropical Cyclone Formation Alert.jpg
Tropical Cyclone LifeCycle.jpg
Tropical Cyclone Surface Pressures.jpg
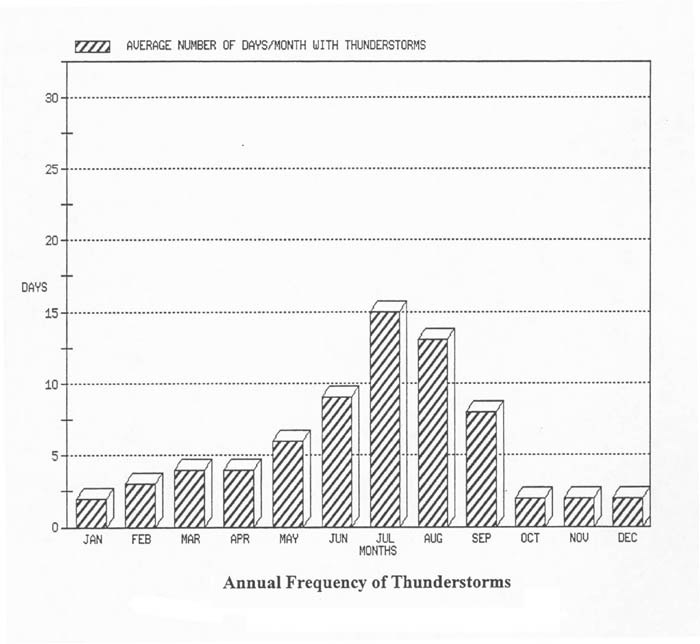
TStormFrequency.jpg
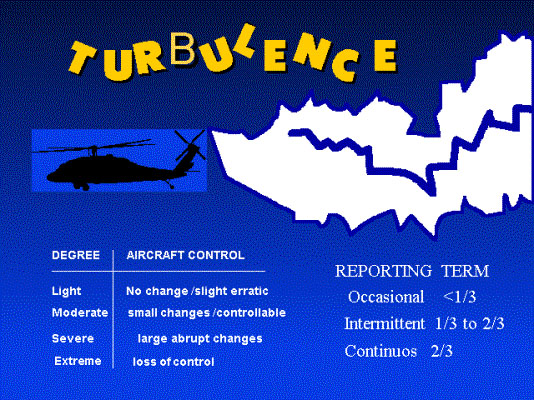
Turbulence.jpg
Typical GOES Visible Imagery.jpg
Typical SIGMETS.jpg
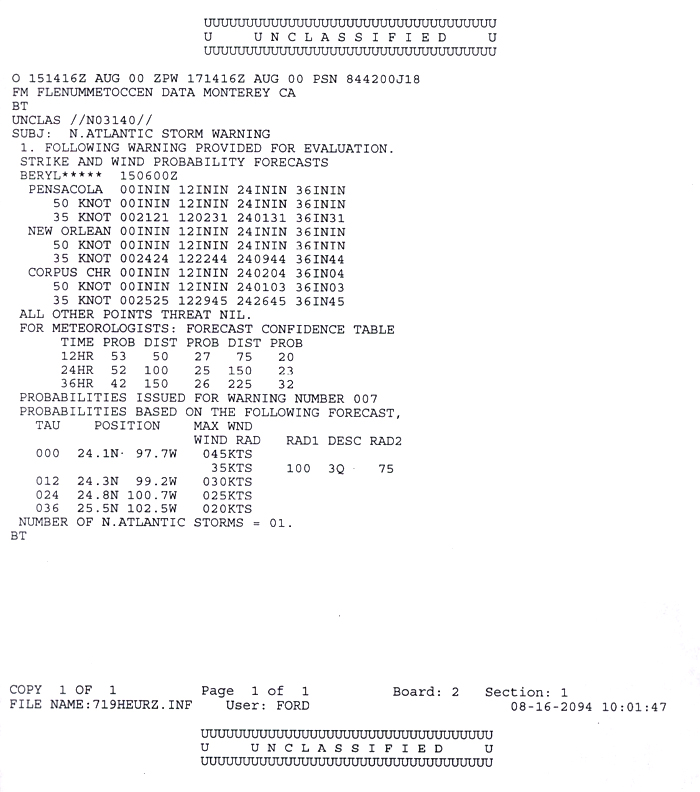
Typical Strike Probability Forecast.jpg
Upper-level Wind Chart.gif
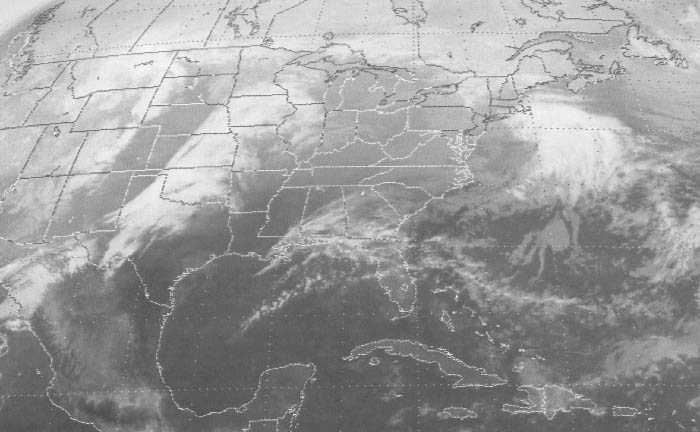
VisibleSatellite.jpg
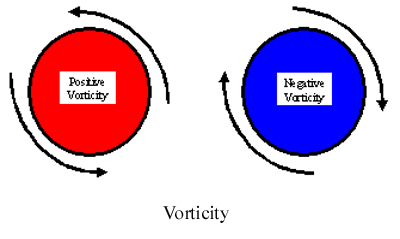
Vorticity.jpg
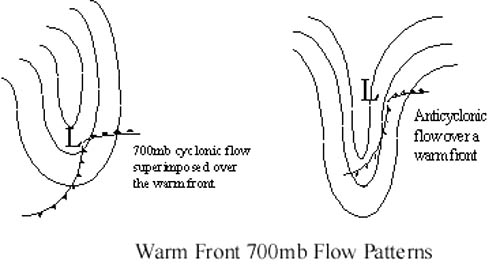
WarmFront700mbFlow.jpg
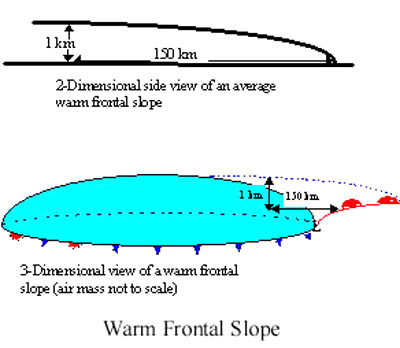
WarmFrontalSlope.jpg
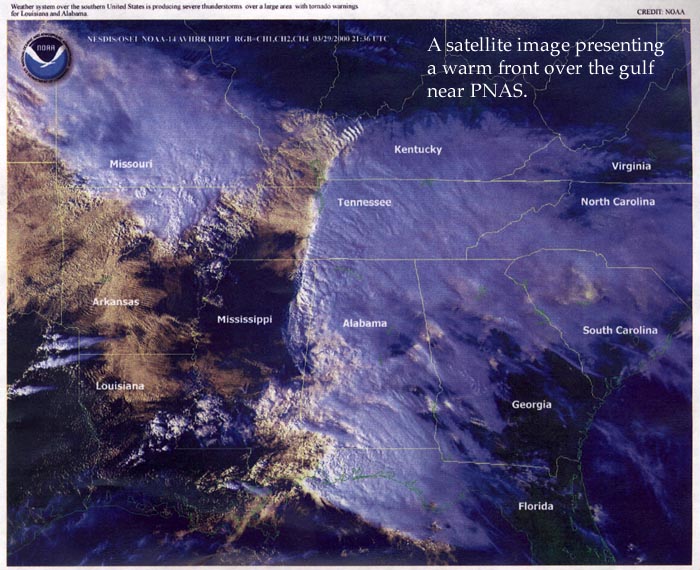
Warm Front at PNAS.jpg
Warm Front Graphic.jpg
WarmFrontPrecip.jpg
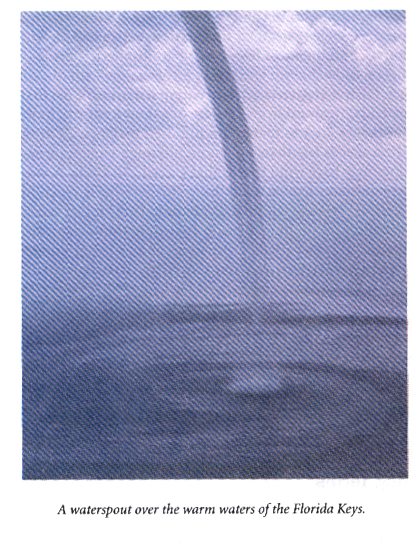
Waterspout.jpg
WaterVaporJetStream.jpg
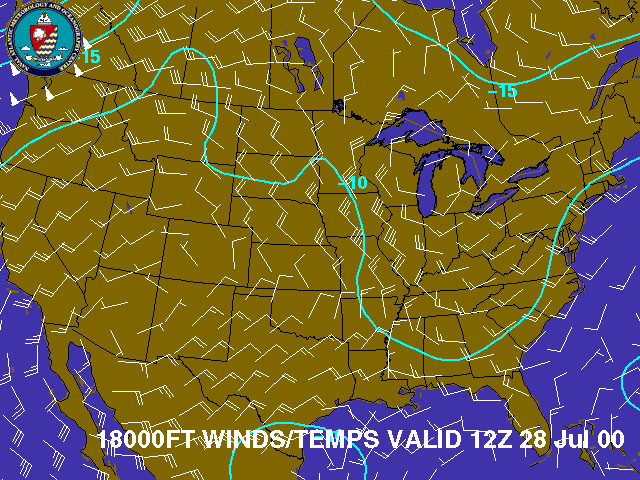
Winds at 18_000ft.jpg